
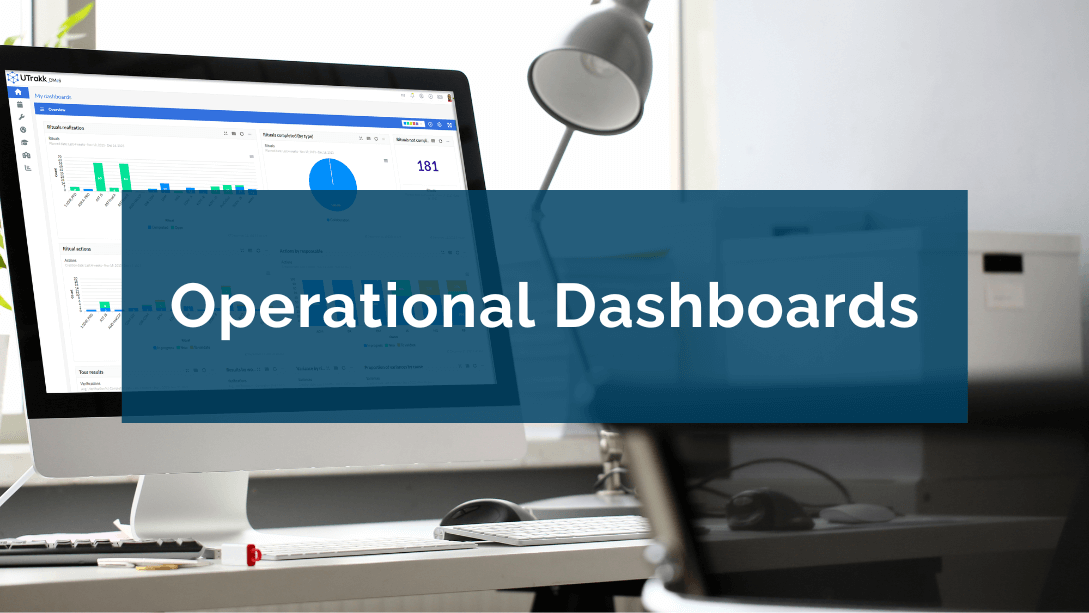
What are operational dashboards (or operations dashboards)?
Three categories of business intelligence dashboards
Business intelligence dashboards are a visual interface that groups and presents a company's specific key performance indicators (KPIs). There are three types of dashboards; each is designed to serve specific strategic, analytical, or operational needs.
The operational dashboard (or operations dashboard) is a powerful tool for day-to-day activities and operational management. All the data of this type of dashboard are often linked to process efficiency, production, quality, and other crucial operational aspects. It provides a comprehensive overview of internal business processes, helping managers to make rapid, data-driven decisions to optimize operations. Its main objective is to enable proactive management of routine tasks.
Operational dashboards are different from analytical dashboards and strategic dashboards:
The analytical dashboard: Traditionally developed by data analysts, this tool focuses on an in-depth evaluation of historical data (past data) and aims to identify trends, patterns, and opportunities for business growth. It is more strategic than the operational dashboard, focusing on understanding the factors underlying past and current performance.
The strategic dashboard: This reporting tool is aligned with the company's long-term objectives and focuses on the indicators that influence achieving strategic goals. It provides a comprehensive snapshot of the company's overall performance, guiding long-term decisions.

Example of an operational dashboard in the manufacturing industry
Let's take the example of an operational dashboard focusing on real-time production monitoring.
Selected key performance indicators:
- Overall Efficiency Ratio (OER)
- Production cycle time
- Waste rate
- Machine availability
Indicator visualizations on the dashboard:
- Bar graph of OEE per production line
- Pie chart illustrating cycle time distribution
- Trend graph of waste rate over time
- Bar chart showing machine availability per shift
Selected operational objectives:
- Maintain FIT above 90%.
- Reduce average cycle time by 15% by year-end
- Reduce waste rate to below 5%.
- Ensure machine availability of 95% or more
In this case, the operational dashboard enables production managers to monitor production line performance in real-time, identify potential bottlenecks, and take immediate corrective action to optimize operational efficiency.
What are the benefits of operational dashboards?
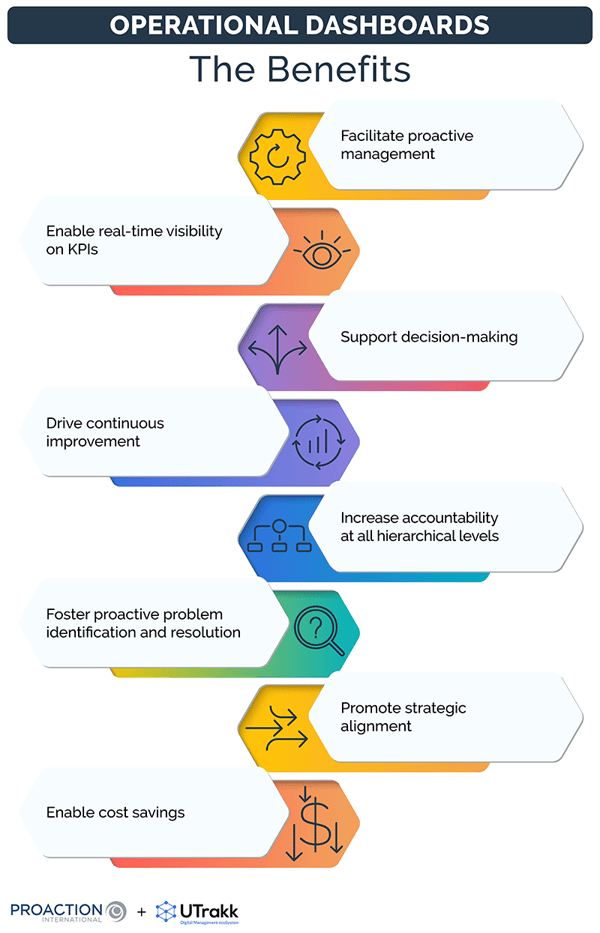
Facilitate proactive management
An operational dashboard provides production managers with a solid foundation for proactive management by offering continuous visibility on operational performance, quickly identifying potential problems, and enabling rapid adjustments to optimize results.
In this way, they help companies to remain agile, anticipate challenges, and maximize operational efficiency.
Enable real-time visibility on key performance indicators
Thanks to operational dashboards, production managers can track performance metrics, see every indicator immediately, and monitor key metrics such as productivity, quality, costs, and lead times in real-time. As a result, each team concerned is constantly informed of current performance, facilitating reactivity.
Support decision-making
By bringing together essential operational data in clear, understandable visualizations, operational dashboards help decision-makers to assess the situation quickly, identify areas requiring action and choose the appropriate course of action. A significant asset in a manufacturing environment where delayed decisions can directly impact productivity.
Drive continuous improvement
By identifying inefficiencies and opportunities for process optimization, manufacturers can implement proactive changes to increase operational efficiency. This iterative approach fosters a culture of continuous improvement within the entire organization, leading to more efficient and competitive processes.

Increase accountability at all hierarchical levels
By making performance visible and accessible to all levels of the organization, an operations dashboard promotes accountability, motivation, and engagement of all team members. They better understand the impact of their work on overall objectives and are more aware of their contribution to operational success.
Foster proactive problem identification and resolution
Operational dashboards enable proactive identification of problems before they become critical. By closely monitoring KPIs, operations teams can anticipate potential obstacles, take corrective action at an early stage, and minimize the impact on production. It reduces downtime and improves operational stability.
Promote strategic alignment
Operational dashboards can be aligned with the enterprise-wide strategic goals. By highlighting relevant KPIs, these dashboards ensure that operational activities are aligned with long-term priorities. It ensures convergence between operational objectives and overall business goals.
Enable cost savings
By taking immediate action on inefficiencies and problems, companies can avoid the additional operational costs associated with production delays, scrap, and unplanned downtime. It contributes to a more efficient use of resources and preserving profit margins.
Steps to create an insightful operational dashboard
The creation of an operational dashboard is part of a structured approach comprising several distinct stages:
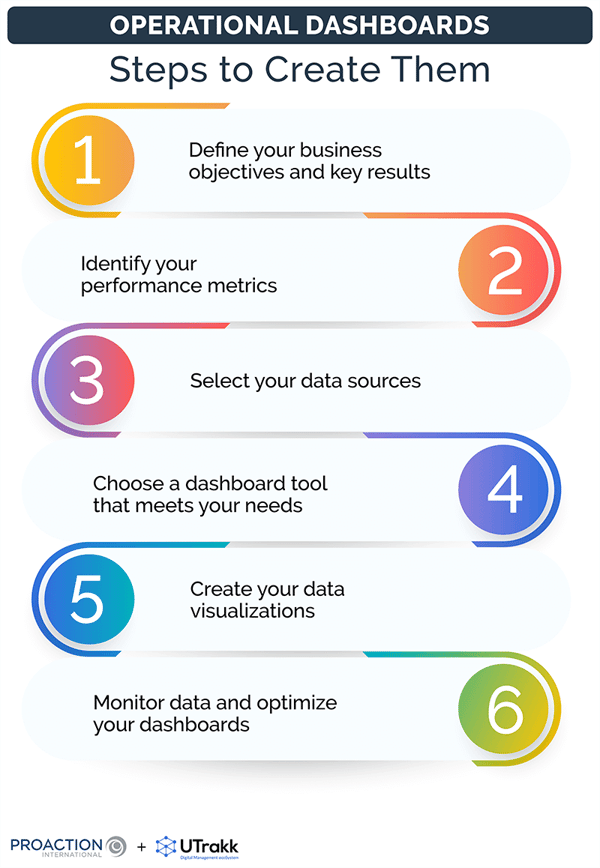
1. Define your business objectives and key results
The first thing to do is to clearly define the specific objectives and results you wish to achieve with the operational dashboard. These objectives include productivity improvement, cost reduction, process optimization, etc.
A clear understanding of objectives will guide the choice of relevant KPIs.
2. Identify your performance metrics
Now is the time to determine the most relevant metrics for measuring effectiveness against the objectives you've defined. Make sure the chosen KPIs are measurable and representative of operational performance.
3. Select your data sources
Identify and integrate the accurate data sources required for the selected KPI measurement. Data can come from multiple systems, such as enterprise resource planning (ERP) software, databases, Excel files, etc.
Ensure you use reliable, accurate, up-to-date, and relevant data.
4. Choose a dashboard tool that meets your needs
Select a dashboard creation tool tailored to your organization's needs. The chosen medium must meet your requirements, facilitate dashboard design and updating, offer customization options, and be compatible with your data sources.
UTrakk dashboards offer real-time monitoring of action plans. They enable you to analyze the variances of the various performance axes and prioritize the actions to be taken:
- Completion of rituals: Check that managers carry out their Gemba Walks correctly.
- Actions by manager: Visualize the workload for each manager.
- Ritual quality: Monitor managerial quality daily.
- Analyze jobs: Analyze discrepancies identified by managers.
5. Create your data visualization
Every relevant information should be as clear and intuitive as possible so that everyone involved can easily understand what it's all about.
Use graphs, tables, pie charts, and other visual elements to make data understandable.
Make sure, too, that the layout is logical and that the critical information is presented in a way that facilitates the decision-making process.
6. Monitor data and optimize your dashboards
Implement a continuous monitoring process. Analyze data regularly to ensure that KPIs are aligned with objectives and adjust the dashboard to meet changing needs.
Be ready to optimize the visual presentation, KPIs, or data from multiple sources according to user feedback and operational evolutions.
Remember, the dashboard must be adapted to the organization's context and environment (market, competition, trends, etc.).
How to set up an operational dashboard with UTrakk
The Dashboards module of the UTrakk Daily Management System (DMS) offers powerful functionalities enabling you to easily create highly customized dashboards structured according to your performance axes (safety, quality, customer service, productivity, human capital, etc.) or key indicators relevant to the different departments, processes, teams and hierarchical levels of your organization.
With UTrakk, you can add data manually and/or integrate it automatically by connecting external OEE data software. It gives managers a complete view of all KPIs from a single, robust platform, updated in real-time.
New: UTrakk lets you integrate a dashboard with your rituals. Now you can track your data and drive performance during meetings and supervision tours, directly from the Rituals module.
Multiple presentation options enable you to visualize all types of data optimally. The DMS supports the most common diagrams, including bar charts, column charts, curves, pie charts, lists (in table form), and indicators (a single number), as well as specialized diagrams such as the safety cross. Color themes can be applied to diagrams, making reading and distinguishing the information displayed easier.
UTrakk's dashboards also include interactive filters, offering managers all available information on their data. They get highly accurate data views according to desired parameters - tag, cause of the deviation, person responsible, department, priority, and more. As a result, you can monitor, analyze, and compare your results with the utmost precision and quickly intervene in problem areas to correct deviations.

Boost managerial and organizational performance with operational dashboards from UTrakk
"What gets measured, gets improved." By this, management expert Peter Druker means it's essential to measure to improve performance.
Thus, dashboards are essential for manufacturers wishing to maximize operational efficiency, stay competitive, responsive, and focused on quality. They are invaluable tools that offer an accurate view of the present and a solid orientation toward a prosperous future. Using UTrakk's integrated dashboards, they can measure, analyze, and improve day-to-day activities and make better strategic decisions, paving the way for improved performance for managers and the organization.