

What is visual management?
Visual management (or “visual control”) is a dynamic management method that relies on visual cues to share information. These cues can include charts, graphs, signs, and any other display that visualizes workflow, performance and problems in real time. The main goal is to create a visual workplace.
Why is this process so effective? Because it simplifies messages, clarifies complex data, and makes them more intuitive, decipherable at a glance.
The origins of visual management
Humans have been using visual methods to simplify information and communication for centuries. However, visual management as such dates back to the 50s, during the development of the Toyota Production System. Indeed, the famous carmaker was one of the first to use visualization of production processes to facilitate understanding and communication between workers and managers.
Today, thanks to its proven effectiveness, visual management has become a fundamental element of many modern management methodologies, including Lean Management.
The main principles of visual control
- Factual management: Decisions are based on precise visual statistical data, taking the guesswork out of the equation.
- Simplicity and clarity: Visual tools are easy to understand, with no need for further explanation.
- Accessibility and transparency: Information is visible and accessible to everyone, from top management to frontline managers and operators.
- Up-to-date information: Data and information displayed are kept up to date to reflect the current situation.
- Engagement and accountability: Every employee can see the impact of his or her work on overall results, which fosters engagement and accountability.
- Continuous improvement: Instant visualization of inefficiencies and problems enables rapid and regular adjustments to processes.
- Standardization: Procedures and guidelines are standardized to ensure efficiency and consistency (all employees follow the same procedures).
- Training: Visual elements facilitate hands-on learning by helping employees understand the work environment and what is expected of them. What they see is therefore more easily integrated, retained and applied.

The benefits of visual management
- Clarification, better understanding: Visual management goes much further than that. It offers a number of advantages that have a significant impact on the internal workings and performance of the organizations that use it.
- Efficient performance management: Performance is tracked in real time via dashboards and key metrics that are accessible to all, enabling rapid reaction in the event of deviations.
- Faster problem resolution: With a visual management tool like a dashboard showing key performance indicators (KPIs), problems are immediately visible. They can be reported by employees and then dealt with directly, preventing them from escalating.
- Informed decision-making: Based on current, accurate facts, managers quickly understand the issues at stake and are able to make better decisions.
- Better information sharing: The visual display of key information ensures that employees at all levels have access to the same data, including real time updates and changes.
- Optimized communication: Visual elements simplify understanding and help overcome language or technical barriers. They make communication more formal and effective, and avoid ambiguity.
- Improved cohesion and teamwork: Full visibility of objectives, progress and responsibilities aligns employees with common goals, and fosters a transparent working environment. This strengthens cohesion, cooperation, trust and commitment.
- Efficient processes and workflows: Clearly visualizing production steps helps identify bottlenecks and eliminate waste, facilitating the improvement and streamlining of operations for greater workflow efficiency.
- Enhanced workplace organization and safety: The use of visual aids not only improves the organization of the workplace, but also makes it safer for people moving around in it.
15 Effective visual management tools
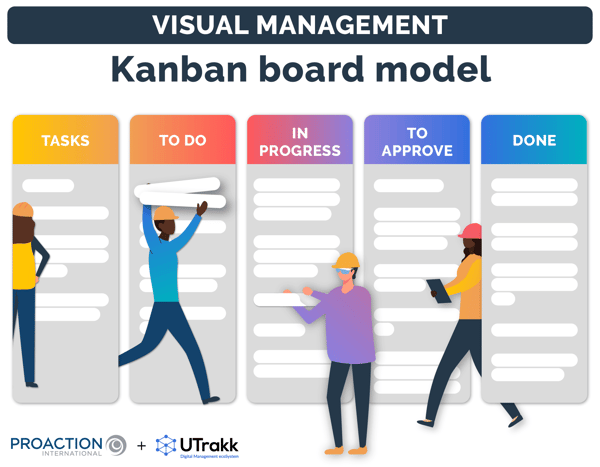
1. Kanban boards
Kanban boards represent the flow of work at different stages of a process. Their main goal is to balance demand with available capacity. They are accompanied by cards and columns to visualize and manage tasks (to do, in progress, completed, etc.).
Specific applications
- Project management
- Software development
- Manufacturing production tracking
- IT support and operations
- Marketing campaign planning and execution
Benefits
- Improved productivity
- Better management of priorities
- Reduced lead times and bottlenecks
- Improved team collaboration
- Simplicity and ease of use
2. Mind Mapping
Mind Mapping is a visual management tool that uses diagrams to organize words, ideas, tasks or issues around a central concept.
Specific applications
- Brainstorming
- Project planning
- Meeting management
- Problem solving
- Note-taking
Benefits
- Better understanding of information
- Creativity and innovation
- Better memorization
- Versatility of use
- Improved communication
3. Design Thinking
Design Thinking is a method that focuses on the end-user. Its aim is to solve complex problems and generate innovative solutions through creativity and iteration.
Specific applications
- Development of new products and services
- Business process improvement
- Marketing and branding strategies
- Services and customer experience
- Technology and IT
Benefits
- User-centric approach
- Creativity and innovation
- Versatility
- Improved team collaboration
- Complex problem solving
4. Value Stream Mapping (VSM)
Value Stream Mapping (VSM) helps to visualize and understand all stages of a process. They show where waste occurs and identify opportunities for improving efficiency.
Specific applications
- Production process optimization
- Lean integration
- Employee training and engagement
- New process design
- Supply chain management
Benefits
- Waste reduction
- Optimization of production processes
- Cost reduction
- Decision support
- Better communication
5. Andon
Andon is a visual or audible warning system, much like traffic lights, used in manufacturing environments to signal problems in real time (quality defects, equipment breakdowns, etc.).
Specific applications
- Detection and signaling of quality defects
- Equipment failure monitoring
- Inventory management
- Workplace safety
- Interdepartmental communication
Benefits
- Rapid problem detection and resolution
- Improved product quality
- Greater transparency
- Employee empowerment
- Support for continuous improvement
6. Heijunka boards
Heijunka boards (Heijunka means "leveling" in Japanese) are used to balance workloads and optimize production.
Specific applications
- High-volume production
- Lean production
- Maintenance management
- Event management
- Automotive assembly
Benefits
- Reduced production fluctuations
- Improved operational efficiency
- Reduce excess inventory
- Improved quality
- Flexible response to customer demand
7. Poka-Yoke
Poka-Yoke (meaning "error-prevention" in Japanese) refers to mechanisms or techniques designed to prevent human errors before they occur in production processes.
Specific applications
- Assembly of consumer products
- Production line verification systems
- Error prevention in the healthcare sector
- Logistics and inventory management
- Financial services
Benefits
- Reduction of errors
- Improved product quality
- Increased productivity
- Cost reduction
- Enhanced safety
8. Pareto diagrams and decision trees
Pareto diagrams are statistical analysis tools that help identify the most important causes of a problem. They are based on the principle that 80% of problems are often due to 20% of causes.
Decision trees are also diagrams, but are used to make decisions based on different variables.
Together, these powerful tools help prioritize problems and facilitate decision-making.
Specific applications
- Quality management (Pareto)
- Inventory management (Pareto)
- Cost optimization (Pareto)
- Risk management decision-making (Decision trees)
- Investment strategies (Decision trees)
- Software development (Decision trees)
Benefits
- Efficient prioritization (Pareto)
- Continuous improvement (Pareto)
- Clear visualization (Pareto)
- Simplified decision-making (Decision trees)
- Risk management (Decision trees)
- Flexibility (Decision trees)
9. UTrakk dashboards
UTrakk dashboards offer real-time visualization of key performance indicators and other critical data to help managers monitor, analyze, and improve operations.
Specific applications
- Industrial production tracking and management
- Operation management
- Project management
- Equipment maintenance and management
- Performance monitoring
Benefits
- Improved visibility on data and KPIs
- Informed decision-making
- Quick problem resolution
- Real-time performance monitoring
- Personalization

10. Visual signage
Visual signals used to guide, inform or warn users in a work environment (lines on the shop floor, signs, badges, labels, panels, etc.).
Specific applications
- Workplace safety (industrial, manufacturing, construction)
- Traffic management (warehouses, logistics centers)
- Public health signage
- Wayfinding in public spaces
- Signage for specific areas
Benefits
- Enhanced safety
- Increased operational efficiency
- Regulatory compliance
- Accessibility
- Enhanced user experience
11. Graphics and posters
This type of visual medium is used to communicate important information, guidelines or data.
Specific applications
- Data and performance display
- Internal corporate communication
- Promotion and marketing
- Orientation and navigation
- Exhibitions and presentations
Benefits
- Improved communication
- Increased engagement and recall
- Effective dissemination of information
- Flexibility of use
- Cost-effective
12. Samples and prototypes
These preliminary versions provide a physical visualization of a product or project under development, facilitating testing, evaluation and understanding of the final product.
Specific applications
- Product development
- Research and development
- Marketing and market research
- Quality standards control
- Usability and market testing
Benefits
- Improved design
- Risk reduction
- Functionality validation
- Cost optimization
- Production optimization
13. Operation sheets
These detailed documents provide precise instructions on how to carry out specific tasks. They generally contain information on procedures to be followed, safety standards, equipment to be used, and critical process steps.
Specific applications
- Process standardization
- Quality management
- Maintenance operations
- Construction or installation instructions
- Description of protocols
Benefits
- Improved quality
- Reduced errors
- Operational efficiency
- Continuous improvement
- Enhanced safety
14. One Point Lessons (OPL)
One Point Lessons are short training sessions or instruction sheets designed to impart concise, targeted knowledge or instructions on a specific key point or skill.
Specific applications
- On-the-job training
- Maintenance and repair
- Introduction of new equipment
- Quality management
- Process standardization
Benefits
- Targeted learning
- Time efficiency
- Ease of implementation and versatility
- Performance enhancement
- Continuous improvement
15. UTrakk Knowledge Center
UTrakk Knowledge Center centralizes and organizes an organization's essential information and resources. It gives employees easy access to important documents, guides, policies, and procedures.
Specific applications
- Production management
- Project management
- Industrial maintenance
- New employee integration
- Training and development
Benefits
- Process standardization
- Centralized access to information and resources
- Improved compliance
- Autonomy and empowerment
- Enhanced team collaboration

Bonus tool: Visual management boards
Visual management boards are visual controls used within an organization to display key information about processes, progress, and performance in a visually engaging and easily understandable manner.
They are extremely useful because they provide immediate visual feedback to all team members about what’s happening within a department or across the organization.
Here are some visual management boards examples:
- Safety metrics board
- Production status board
- Project status board
- KPI dashboard
- 5S board
- Maintenance schedule board
- Employee performance board
- Inventory management board
- Six Sigma board
Each visual management board can be customized to fit specific operational needs or environments.
Tips for implementing visual management in your organization
Assess needs and existing processes
Start with a thorough assessment of current processes to identify areas where visual management could bring about significant improvements. Look for bottlenecks, inefficiencies, and opportunities to create a more transparent, clear and easy-to-navigate work environment.
Involve teams from the outset
For your visual implementation to work (including over the long term), your employees' buy-in is crucial. Engage them from the outset by taking their needs into account and soliciting their suggestions for process improvement. This will not only encourage the adoption of new practices, but also ensure their application and ongoing integration into the corporate culture, thanks to the active support of the teams.
Train staff for the principles of visual management
Involving a team also means ensuring that every employee understands how to use the visual controls and supports you want to put in place. To this end, organize regular training sessions to teach the principles and importance of visual management.
Roll out new initiatives progressively
As with any change, start small. Introduce new types of visual management gradually, to give employees time to adapt. Start with pilot improvement projects or specific departments before rolling out the practices to the whole organization.
Use tools designed to meet your objectives
As you've seen, there are many visual tools. Instead of trying them all, select visual management ideas that specifically meet your company's needs, even if it means adding to them later.
Monitor and adjust systems as necessary
Analyze the impact of your visual indicators by collecting feedback and measuring performance against defined objectives. You can then adjust practices if necessary, based on the results.

Embrace visual management to drive performance efficiently
Visual management can schematize, explain and clarify, but it's more than that. More than simply improving visibility via a set of tools or techniques, this method is a powerful strategic lever for improving operations management, safety and organizational efficiency.
It's a management philosophy that also works on a human level, improving communication and transparency within teams, enabling every employee to clearly understand processes, objectives and responsibilities.
Integrating visual management into your organization means making the choice to create a more open, collaborative and inclusive working environment, with the key to far superior performance.